INSTITUTION
Artist Archives Initiative
New York University
DATE
2020-21
ROLE
Assistant Director for Linked Data Research
LINKED DATA R&D
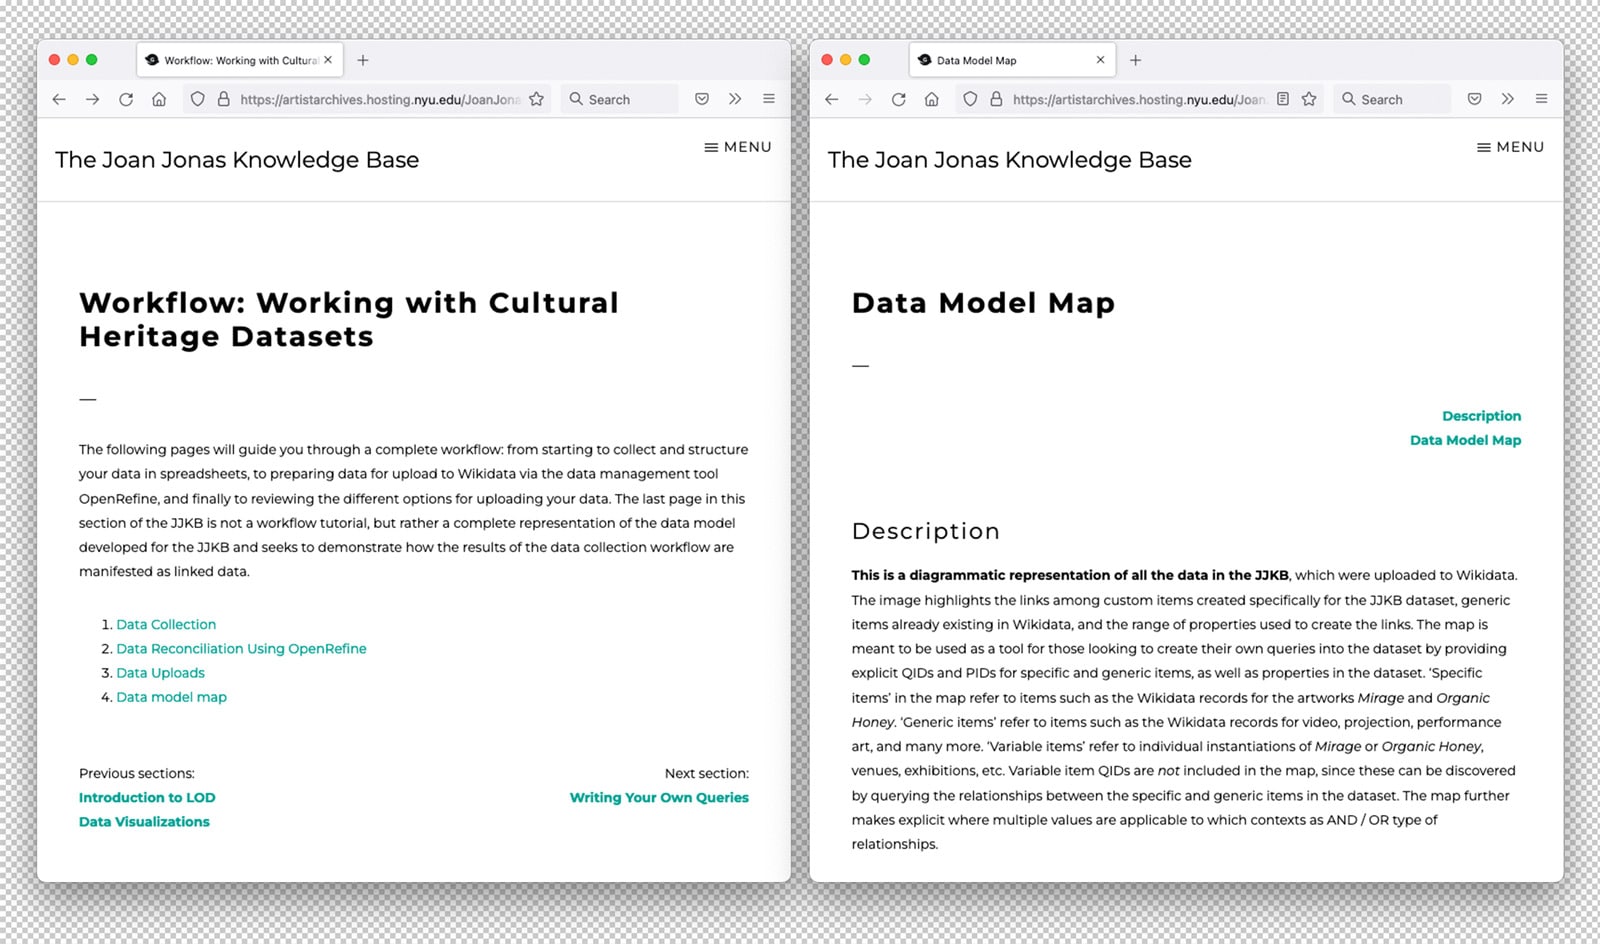
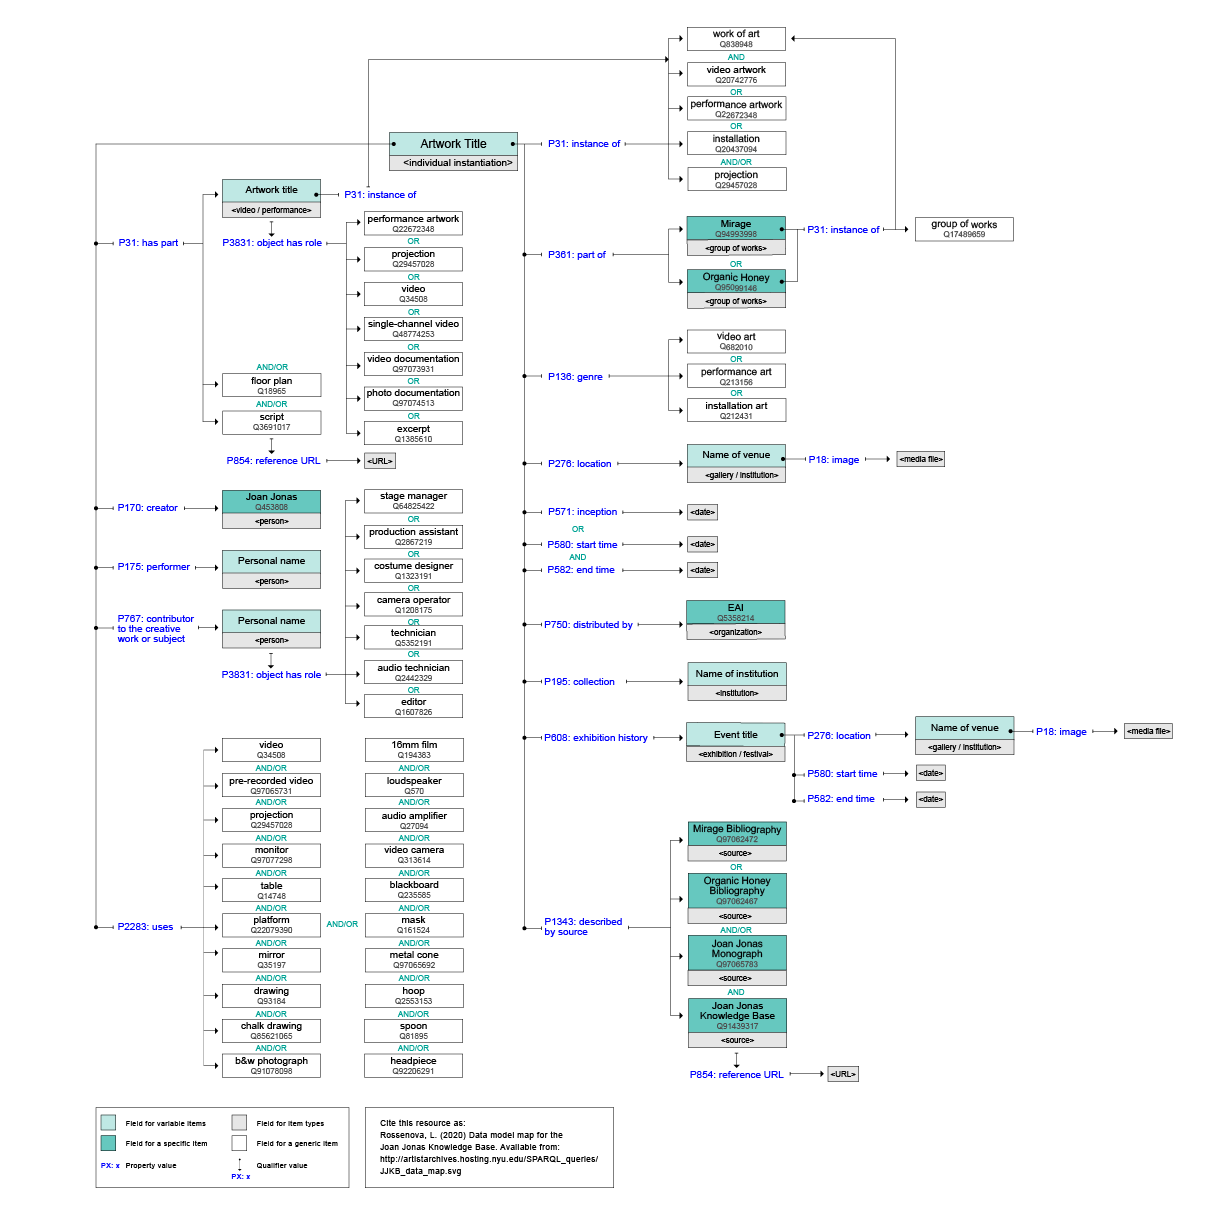
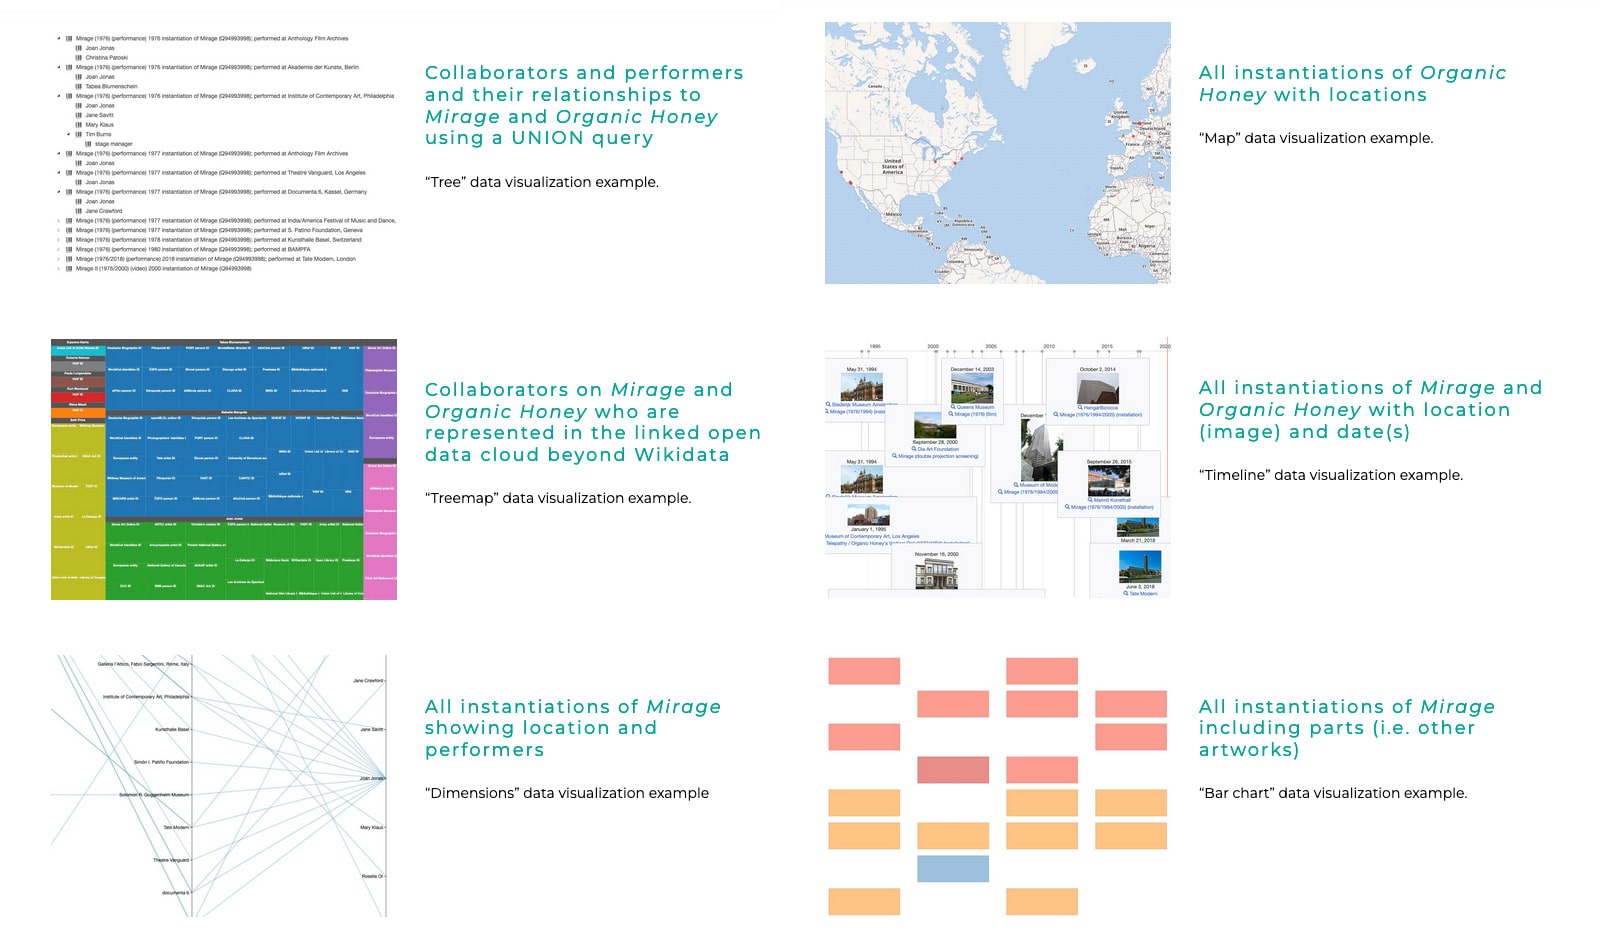
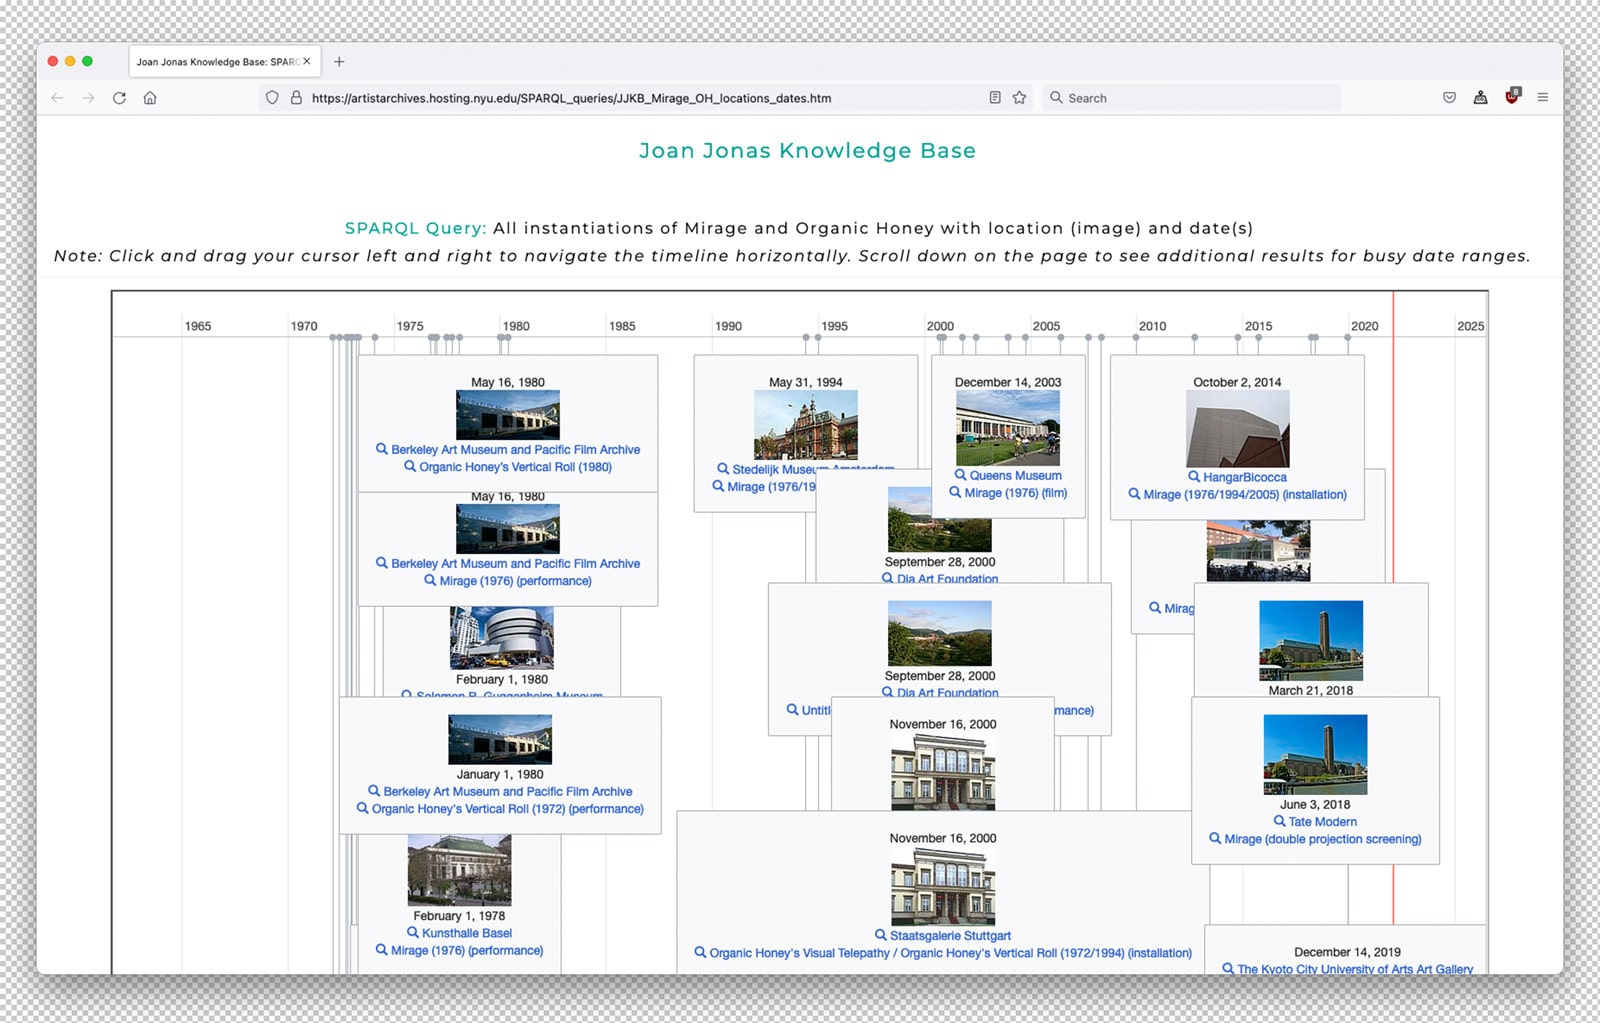
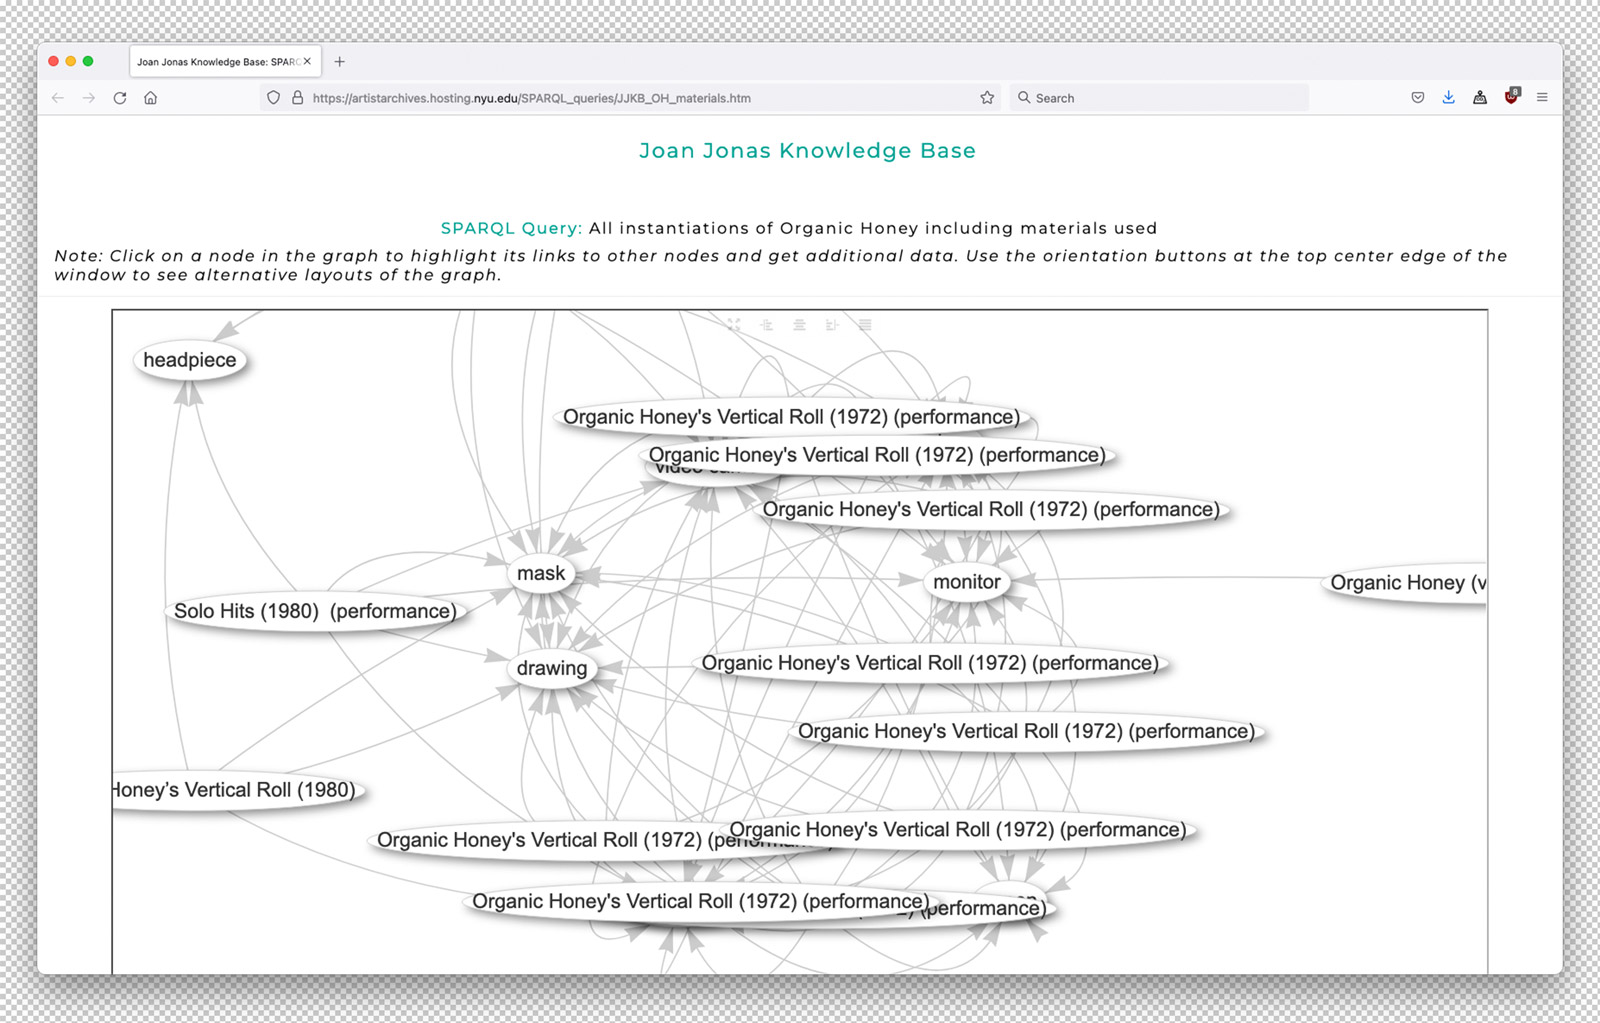
Research, data modeling and content design for the Joan Jonas Knowledge Base, a project of the Artist Archives Initiative based at New York University. Working directly under the Technology Research Director, I contributed to the project with research into performance and installation art data modeling and uploaded a small dataset to Wikidata. Working collaboratively with the tech and curatorial teams, I developed SPARQL queries and data visualizations relying on the Wikdiata Query Service in order to display the most interesting aspects of the data. I also contributed to the documentation and educational materials on linked data published on the final project website.
![screenshots of the joan jonas knowledge base website focusing on the linked data research](https://lozanarossenova.com/wp-content/uploads/2022/01/jjkb-site-min.jpg)
![a data model diagramme for the dataset in the Joan Jonas Knowledge Base](https://lozanarossenova.com/wp-content/uploads/2022/01/JJKB_data_map.png)
![GIF of a scroll through a Wikidata page for one of the artworks in the JJKB](https://lozanarossenova.com/wp-content/uploads/2022/01/jjkb-wikidata.gif)
![screenshot of data visualization thumbnails from the JJKB website](https://lozanarossenova.com/wp-content/uploads/2022/01/jjkb-data-viz-examples-min.jpg)
![example data visualization page from the JJKB showing a timeline](https://lozanarossenova.com/wp-content/uploads/2022/01/jjkb-data-viz-timeline-min.jpg)
![GIF of a graph viz interaction](https://lozanarossenova.com/wp-content/uploads/2022/01/new_JJKB_GIF.gif)
![example data visualization page from the JJKB showing a graph](https://lozanarossenova.com/wp-content/uploads/2022/01/jjkb-data-viz-graph.jpg)